By Katherine Rowe – Planning Manager, Tableau
Data analytics now play a growing and crucial role in how sports organizations like Team USA are making decisions and improvements to their programs.
As a proud partner of Team USA, Tableau has been working with a number of the National Governing Bodies (NGBs)—the organizations that manage and oversee individual sports— to help them see and understand data related to performance, training, and more.
With my background in sports analytics, I have a unique perspective on the intersection of data and sports. I had the opportunity to work with Tableau solution engineers to develop visualizations for nine different NGBs representing Team USA at the Olympic Winter Games Beijing 2022. Through the process, we learned a lot about each sport, and how data can drive new insights and inform strategic decision-making.
Laying the Foundation
How do you approach data analysis when you are not a subject matter expert?
We recognized at the onset of the project there was one key challenge: many of us had never seen these sports in action, let alone analyzed relevant data from these sports.
As with any customer, data discovery calls were essential. Duncan Wingfield, Tableau associate solution engineer, who worked with USA Nordic Sport and Ski & Snowboard Teams knew that hearing directly from former Olympians, high performance directors, and NGB leaders was going to be a foundational piece of the process. This was critical for identifying the insights and the backstories that were needed to build visualizations that would be authentic, compelling, and tell the right story. Our process included:
- Starting with secondary research by reviewing each sport’s world governing body website and analytical applications related to the sport and/or athletes.
- Using initial calls to build rapport and ask open ended questions to understand pain points, rules of the sport, how teams train and manage data.
- Identifying key contacts and reviewing and approving deadlines.
- Following up with notes, internal meetings, and questions as needed.
Many NGBs are managed by a small staff and do not always have the in-house capability to explore and leverage their data. Flexibility and setting expectations was key. Not all of the NGBs are mature in their data journeys, and it was important that we were able to meet them where they are, and offer realistic ideas based on each organization’s facility with data.
From Data Collection to Dashboard
Over the course of several weeks, we gathered data from a variety of sources, including:
- Public data on the sport, typically through each sport’s world governing body and competition results
- Data from the NGBs directly, specific to the data stories addressed in discovery
- Additional public data, based on what NGBs had available to augment our data sets
All of this data collection required the typical cleaning and prep process. In this phase, as those stories emerged, it was important to get a gut check with our NGB partners. We built visualizations and then followed up with messages and meetings with our NGB partners to gain additional perspective that sometimes resulted in changes to our approach. Luge athlete Gordy Sheer, Olympic Silver Medalist and marketing director for the USA Luge Association, commented that, “In luge, you can’t win a race at the start, but you can certainly lose it.” That bit of information led Tableau Lead Solution Engineer, Christian Felix, to realize we needed a viz focused on how luge events are won and lost at the start.
Data Lessons Learned
Our team built more than a dozen visualizations to help our NGB partners. In a few short months, the Tableau team went from having minimal knowledge of sports like luge, biathlon, and curling, to taking the lead in unlocking insights that these teams can now apply in their pursuit of gold.
The data lessons learned extend well beyond these individual sports and can be applied to any team or organization interested in using the power of data. The lessons fall into four categories: reinventing strategy, showing connections between minor inputs and major outcomes, challenging assumptions, and identifying and managing tradeoffs.
Showing Connections Between Minor Inputs and Major Outcomes
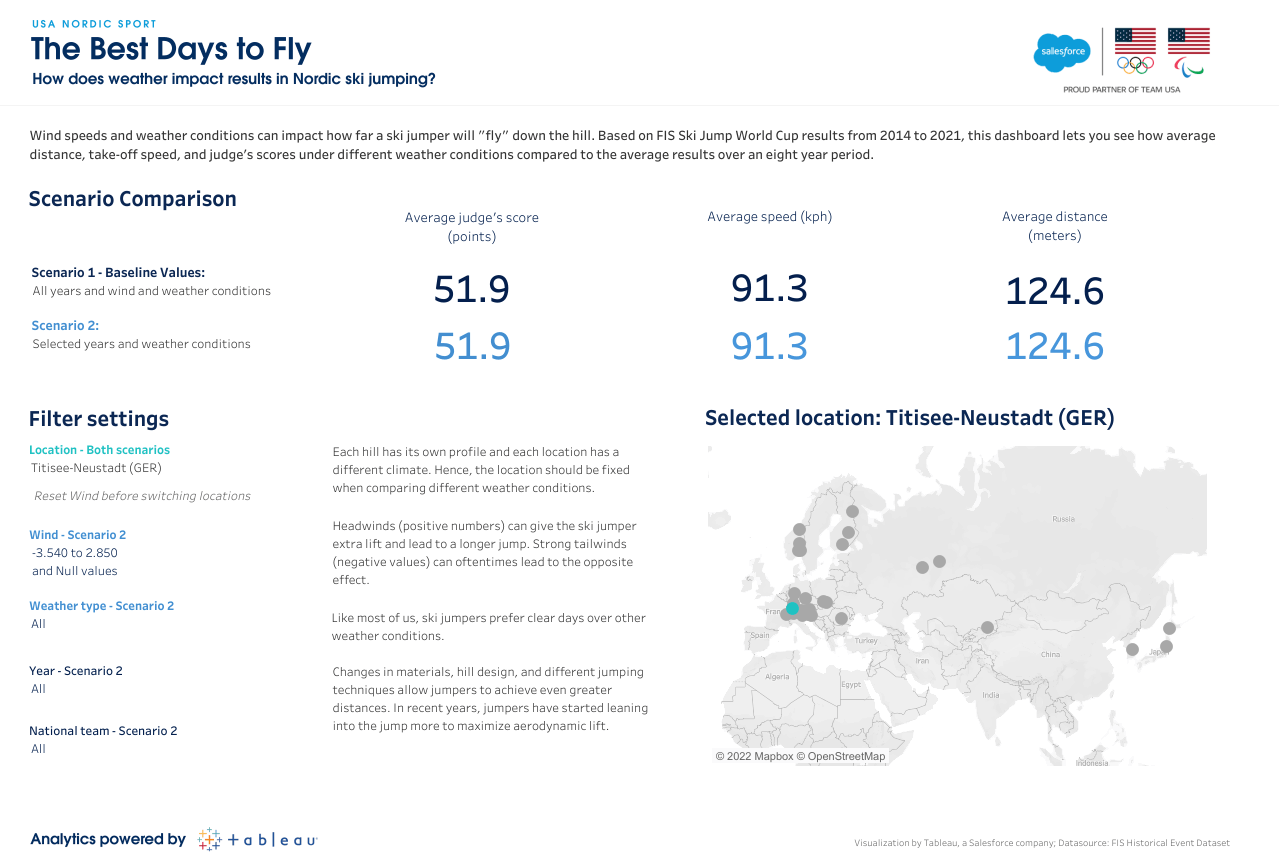
Environment and slight modifications are crucial to sports like bobsled, luge, and ski jumping, where millimeters and thousandths of a second matter. We learned how important external effects such as weather, wind, and hill/track conditions can be to the outcome of a team’s or individual athlete’s performance, especially in the case of USA Nordic Sport.

Click here to view the full story on tableau.com.